Summary #
Quite often, problems relating to some sites (or every site) loading slow are related to latency and/or packet loss issues. If it’s really bad, it can even cause your SecureSchool appliance to work much harder then it needs to since it has to retry a lot of it’s requests. Packet loss can be caused by any number of things, and we’ll briefly touch on them in this article. Additionally, we’ll point you at the tools in your SecureSchool appliance you can use to help pinpoint the problem, as well as some tools for your administrative workstations.
Latency & Loss Due To A Maxed Connection #
The most common cause of packet loss & latency is simply that there is no more bandwidth available for you to use. For example, if your connection to the Internet is a T1 line, you have a 1.5Mbps. If you have several people streaming video, everyone checking email, and some web browsing going on, it’s easy to max out this connection. This is the easiest cause of loss & latency to troubleshoot. On your SecureSchool appliance, go to “Logs & Reports” -> “Reports & Statistics” -> “Traffic Graphs”, and look at the graph titled “Traffic on outside interface – past day – 5 Minute Average”. The green area represents data coming in from the Internet, and the blue line represents data going out to the Internet. Here’s an example graph:
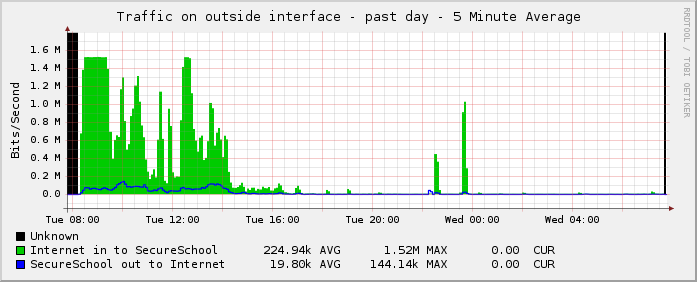
This graph is an example of a maxed out T1 line. Notice how shortly after 8am the graph has a flat top to it. That typically means that the connection is saturated and cannot take any more. Additionally, we know that the connection is a single T1 line, and the graph indicates that there’s never more then 1.5Mbps of bandwidth.
If you are out of bandwidth, you need to either put more limits & restrictions on what people can do on the Internet, or purchase more bandwidth. If you have a T1 line, it’s usually a smart move to upgrade your connection to something like a cable modem, since you can typically get a lot more down stream bandwidth for your money, and you can typically even get static IP addresses if you need them. You can also usually get a cable modem installed in less then 30 days, so it’s a good quick fix.
Latency & Loss Due To A Bad Connection or ISP #
If you’re not out of bandwidth, there could still be problems in the connection itself. For example, any type circuit (T1, T3, Cable, Ethernet, etc) can have problems with the router interface, the cable plant, the CPU on the router…the list is endless. The first step in troubleshooting this problem is to find out exactly where the problem is. To do this, you need to use a traceroute tool. SecureSchool has a tool called “”Mtraceroute” that works very well and gives detailed results. To access this tool, go to “Tools & Tests” -> “Tools” -> “Mtraceroute”. Fill in the following fields:
- Hostname: www.k12usa.com, or whatever site is acting slow. If you have no Internet connection, use an IP address (12.20.5.53 is www.k12usa.com)
- Count: 10 for a quick test, 100 for a good test. Each “count” takes about 1-1.25 seconds to run.
- Do not Resolve DNS: Check this if your Internet connection is completely down and you’re trying to find out why.
Once you fill in the fields, click on the “Go” button. You’ll get results that look similar to this:
                                    My traceroute  [v0.72]
secureschool.XXXX.YY.k12us.com (0.0.0.0)                       Wed May 12 08:29:13 2010
Keys:  Help   Display mode   Restart statistics   Order of fields   quit
                                                     Packets               Pings
 Host                                              Loss%   Snt   Last   Avg  Best  Wrst StDev
 1. ???
 2. 172.31.254.9                                    0.0%   110   23.2  17.2   1.3 403.1  57.2
 3. 172.16.100.1                                    0.9%   110   14.1  13.5   1.3 353.1  44.7
 4. edge.tiu11.org                                  1.8%   110   22.1  13.3   1.2 375.4  42.6
 5. 242.83.220.216-wireless.static.stingcomm.net    2.8%   110  702.5 619.5 220.1 1030. 169.2
 6. sl-st2-phi-2-1.sprintlink.net                   1.8%   110    7.4  17.5   5.7 275.6  35.5
 7. sl-bb24-pen-2-0.sprintlink.net                  2.7%   110    9.4  17.1   6.2 281.3  40.8
 8. sl-crs1-pen-0-8-0-0.sprintlink.net              4.5%   110    7.8  18.5   6.6 229.5  34.9
 9. sl-crs2-rly-0-0-5-0.sprintlink.net              1.8%   110   23.0  18.8   8.9 179.2  24.9
10. sl-crs2-dc-0-4-0-2.sprintlink.net               0.0%   110   11.7  16.0   9.5 129.1  14.5
11. sl-st31-ash-0-1-0-0.sprintlink.net              0.0%   109   47.6  18.2  10.9  79.8  13.8
12. 192.205.37.109                                  0.9%   109   12.1  18.9  11.7  94.9  15.7
13. cr2.wswdc.ip.att.net                            0.0%   109   17.4  24.9  13.6 255.9  33.1
14. cr2.n54ny.ip.att.net                            0.0%   109   14.0  28.6  13.6 484.7  52.8
15. cr1.n54ny.ip.att.net                            0.0%   109   25.4  30.4  14.4 440.1  47.9
16. cr81.nw2nj.ip.att.net                           0.9%   109   23.2  27.6  13.9 387.3  40.6
17. gar3.nw2nj.ip.att.net                           0.0%   109   24.9  28.8  13.2 334.4  35.6
18. 12.86.32.74                                     0.9%   109   30.7  29.6  16.5 579.4  59.9
19. 172.32.254.253                                  1.8%   109   51.7  29.0  17.0 569.0  53.6
20. wwwbalancer.k12hq.com                           1.8%   109   26.3  34.4  16.9 520.3  67.8
In this example, there are several problems. First problem is latency. The columns “Avg”, “Best”, and “Wrst” show ping times, and the “StDev” column shows the standard deviation of the samples. In this example, the “Wrst” column is the first place I look since the numbers are VERY high. In this example, the 1st hop (the default gateway) isn’t answering pings, so you have to manually check it using a ping tool. That tested OK in this case. The 2nd hop shows a very high “worst case” of 403ms, and a StDev of 57.2, indicating that it’s very erratic between good and bad times. This doesn’t necessarily mean there’s a problem, since some routers do throttle pings to themselves. However, this latency continues all the way through to the final destination, so the odds of something being wrong between hops 1 & 2 are very good. It could be the line, router interfaces, or the routers themselves.
Next we’ll look at packet loss. Any loss is bad for a connection, especially if there’s a proxy server involved. We first see loss of 0.9% at the 3rd hop in this example. Just like with latency, this doesn’t necessarily mean there’s a problem right here, because some routers throttle pings to themselves. However, we see the loss continue through to the final destination. This means that there’s something wrong with the line, interfaces, or routers between hops 2 & 3.
A tool you can run on your workstation that we recommend is called PingPlotter. They have a freeware version available you can try (http://www.pingplotter.com/downloads/pngplt_1.exe), as well as a “Standard” and “Pro” version you can purchase (http://www.pingplotter.com/featurecomp.html). For the purpose of this example, we’ll show the freeware version. Once you install and run the tool, you’ll get a screen like this:
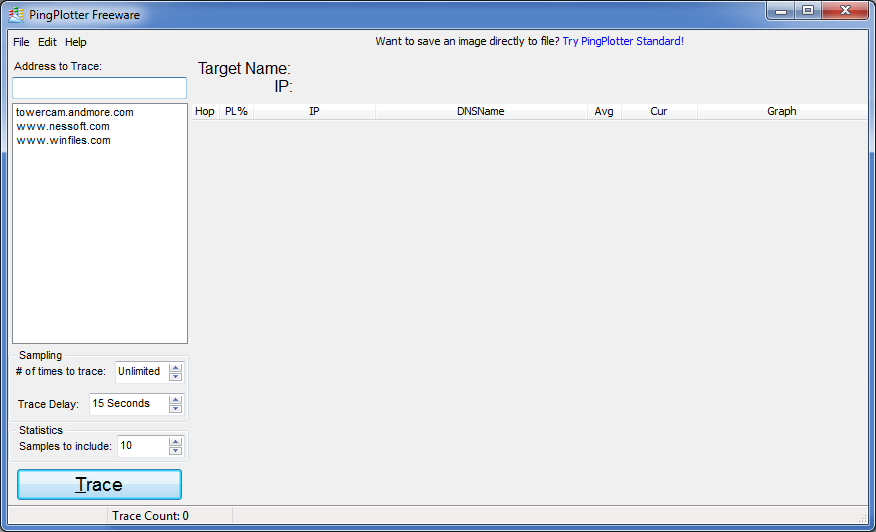
To get PingPlotter running to test your Internet connection, you need to set a few things:
- Address to Trace: www.k12usa.com, the site that’s slow, or an IP address if you think your connection is completely down (12.20.5.53 is www.k12usa.com)
- # of times to trace: Unlimited
- Trace Delay: 1 Second
- Samples to include: 300 is a good number since it will give you a sample of a 5 minute window
Once you get your settings in, press “Trace”. As it works, the screen will update the statistics and you’ll get something similar to this:
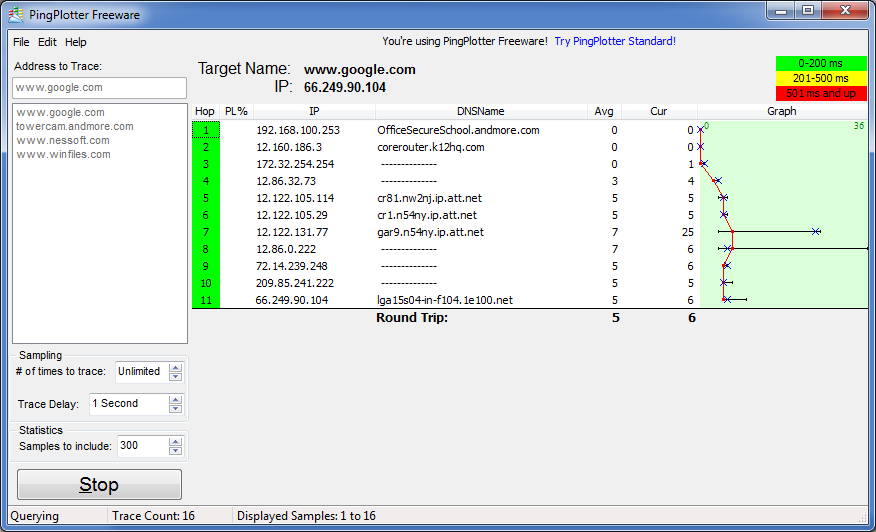
This is an example of a good clean trace. If there was loss, you’d see a number in the “PL%” column. Also, depending on the latency, the background color behind the hop number will change to yellow or red. The graph to the right shows most of the important data. The long horizontal line (like on hop 8) shows the range of ping times. The blue “X” on the line is the current ping time, and the red dot on the line is the average ping time. For this example, the average round trip ping time to the final destination is 5, and the last sampled time was 6. The routers at hop 7 and 8 are probably throttling total pings to themselves, which is why there is a wider range at those routers then before and after them.
Once you pinpoint the loss, you have to now figure out what to do about it. If the loss is between your appliance and your appliance’s default gateway, AND that gateway is a “local” device and is physically located in your building with an ethernet connection between the two devices, then you have a local problem. This is usually very rare, but can be caused by an interface auto-detect mismatch, a bad cable, or a bad interface on one of the devices (which is even more rare).
If the loss is on the 2nd hop, then it’s probably a line problem or a router problem. It could be that you are out of bandwidth, or that your ISP is doing some type of throttling and some packets are getting sacrificed. You need to look at the names of the routers to find out where the problem is. Most of the time the routers have hostnames assigned to them to make troubleshooting easier. For example, in the PingPlotter capture above, we can see that hop #7 is in AT&T. Once you prove that problem is not between you and your default router, it’s probably best to give all the information you’ve collected (in the form of screen shots and txt files) to your ISP and let them diagnose the problem.


