Summary #
A frequent question we get here is “I have X for an Internet connection, and the graphs show that I’m using it all. Where is it all going?”. There is lots of data in SecureSchool that can show who is going where and how much bandwidth it’s taking. There’s no way to say “You need a XMbps connection” based on looking at the data, but it can at least help you pin down what’s going on.
Traffic Graphs #
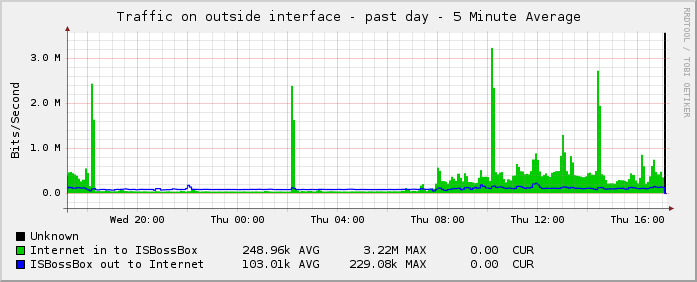
The first place to look is to see how much bandwidth you’re actually using. To see traffic graphs, go to “Logs & Reports” -> “Reports and Statistics” -> “Traffic Graphs”. There are several different graphs here, showing either the outside interface or the inside interface over different time periods. Here’s a sample graph for the outside interface over the last day:

The green area of the graph represents the traffic coming into the appliance, and the blue line represents the traffic going out of the appliance.
Inside & Outside Traffic Stats #
The next place to identify immediate sources of bandwidth use are the Inside/Outside Traffic stats. To see these, go to “Tools & Tests” -> “Status” -> “Inside Traffic” or “Outside Traffic”. You’ll get a display that looks similar to this:
(fxp1) secureschool.xxxxx.yy.k12us.com at May 13 16:00:02 - May 13 16:17:08
 Summary: 7247684 data bytes, 7948784 all bytes, 39 records
     From           Port         To            Port  Proto     Data       All
172.16.5.121       client  172.16.1.1         8080    tcp    4368781    4514021
172.16.1.1         8080    172.16.5.121       client  tcp     895379    1060459
172.16.1.1         8080    172.16.5.144       client  tcp     750716     782564
172.16.1.1         8080    172.16.5.110       client  tcp     322881     353817
172.16.1.1         8080    172.16.6.251       client  tcp     141006     158014
172.16.1.1         8080    172.16.6.40        client  tcp      44197     125813
172.16.6.40        client  172.16.1.1         8080    tcp      52173     119269
172.16.5.110       client  172.16.1.1         8080    tcp      90542     113414
172.16.1.1         8080    172.16.5.117       client  tcp      74012      87980
This display always shows you the traffic from the top of the hour until “now”. So if you load the page at 4:17pm, you’ll see all the traffic from 4:00pm until 4:17pm. There is a drop down on the page where you can also choose to see the whole day, or the last 7 days. (The reports for whole days take a while to load since they are so large.)
Analyzing this data isn’t horribly difficult. The “From” column shows who is sending the traffic. The “To” column shows who is getting the traffic. The “Port” and “Proto” columns show type and port for the connection. The data column shows how much data was in the connection. If there is an IP that’s sent/received a lot of data, you can search for that IP in the Filter Log (“Logs & Reports” -> “Filter Log”).
This display always shows you the traffic from the top of the hour until “now”. So if you load the page at 4:17pm, you’ll see all the traffic from 4:00pm until 4:17pm. There is a drop down on the page where you can also choose to see the whole day, or the last 7 days. (The reports for whole days take a while to load since they are so large.)Analyzing this data isn’t horribly difficult. The “From” column shows who is sending the traffic. The “To” column shows who is getting the traffic. The “Port” and “Proto” columns show type and port for the connection. The data column shows how much data was in the connection. If there is an IP that’s sent/received a lot of data, you can search for that IP in the Filter Log (“Logs & Reports” -> “Filter Log”).
Filter Summary – Previous Days #
A nice place to look at a summary of various statistics is the nightly Filter Summary. You can access this by going to “Logs & Reports” -> “Reports & Statistics” -> “Filter”. Once you’re there, pick a date to view, then select a report from the list. For example, if you’re trying to find out what site takes most of your bandwidth you can look at the “TLD+1 by size” report, which shows you how much data a domain transferred, and what percentage of the total daily bandwidth it took. (TLD means Top Level Domain. So TLD+1 would be k12usa.com, TLD+2 would be kb.k12usa.com .)
There are lots of other interesting reports here, like “Users by size” which will show you how much data specific users have transferred. This report only has useful data if you’re authenticating connections to SecureSchool. In this report, all Authentication Exceptions are seen as user “-” since we cannot tell who the user was.
Filter Summary – Present Day #
In addition to looking at summaries of web traffic for previous days, you can look at the “TLD+1 by size” report for sites that are being loaded during a given time period. Under “Logs & Reports” -> “Filter Log”, you can put in search criteria just like you would for looking for a blocked site (username, IP address ,or just leave it blank). Before pressing “Generate View”, change the first line to read “View Log for a particular time”, then select a time period. Under that, change the selection from “Show all log entries in detail” to “Show summary of web sites visited”. When you run that report, you will get a very similar report to the “TLD+1 by size” report under “Logs & Reports” -> “Reports & Statistics” -> “Filter”.


